The chart below shows when a selection of badly affected countries suffered their peak rates of Covid-19 infection.
The data (from https://www.europeandataportal.eu/) has been processed to show for each country the highest reported day of positive cases, the date when that occurred, their trend of cases, and a heatmap to visualise the data. Yesterday, 19th June 2020, is the last day for which we have data.
Click on the chart image to make it bigger if it is not clear.
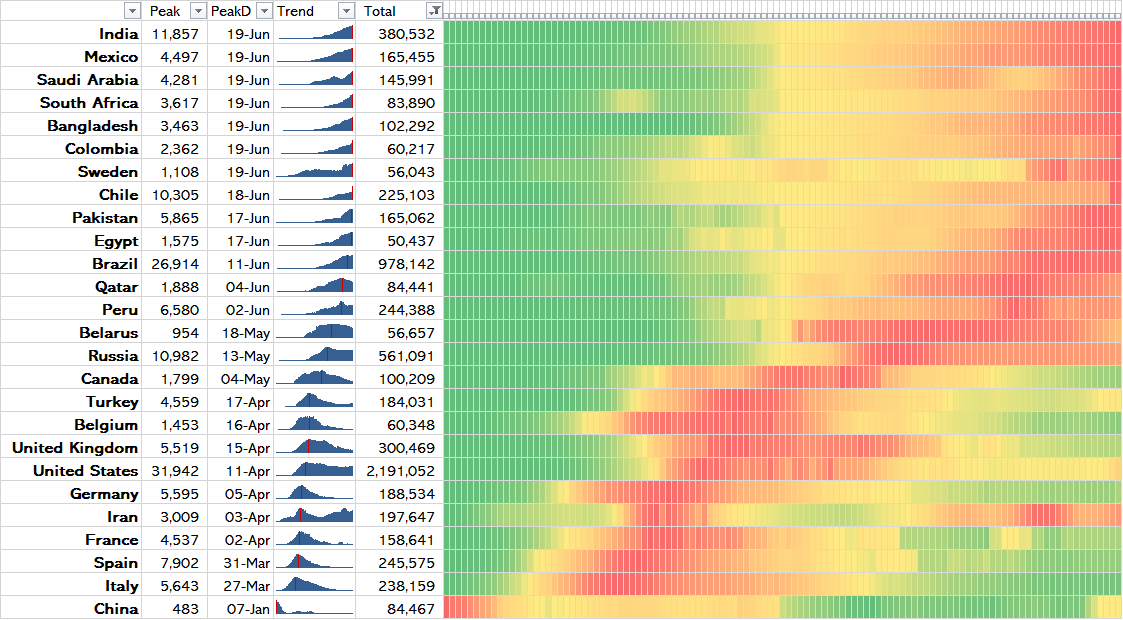
Those countries in the top half of the table have yet to reach their peak of Covid infection. The countries toward the bottom of the table are well past their peak, and in some cases (definitely not USA or Iran) have brought detected infections down to a few hundred per day or fewer from many thousands a 60-90 days ago.