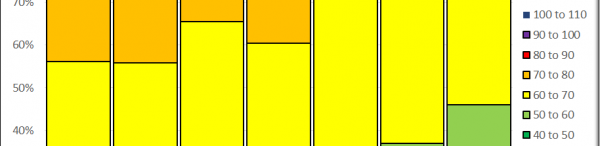
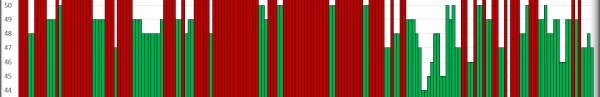
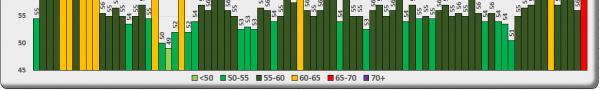
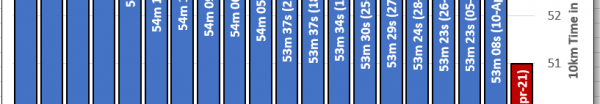
Pictured below is a chart showing my heart rate measured during (approximate) sleeping hours of midnight to 7am daily for the last seven months (October 2020 to April 2021 inclusive). There were around 96,000 heart rate measurements made by my sports watch, and only those taken between midnight and 7am were used below. Apparently my…