I have been collecting my heart rate data from my sports watch continuously since 15th October 2020. As of today (15th April 2021), I have 183 days of data or half a year with a total of 89,662 (non-exercising) heart rate readings.

I am most interested in my sleeping heart rate and heart rate when exercising. Today I decided to put together an Excel workbook which will visualise my heart rate for the first 7 hours of every day (i.e. the time when I am typically asleep) for each of the 182 days for which I have data.
In a new worksheet, I created a filter to grab all of the data relating to a particular day (found in cell R2):
=FILTER([pulseRateAnalysis.xlsx]DayByDay!$B:$E,[pulseRateAnalysis.xlsx]DayByDay!$B:$B=R2)
and then added a new column to calculate the minute of the day that each pulse reading was taken.

I then binned this data at 5 minute intervals. 0-5, 5-10, 10-15, and so on up to 415-420 which is the end of the first 7 hours of the day. Where there was more than one heart rate reading in an interval, I averaged the readings, and on the few occasions where there was no reading in an interval, I used the reading from the previous interval.

In order to use different colours to show different ranges of measured heart rates, I made columns for <50, 50-55, 55-60, 60-65, 65-70, and 70+ BPM which would be the data series for the column charts I planned to make. (Click on any chart below to view in full size.)
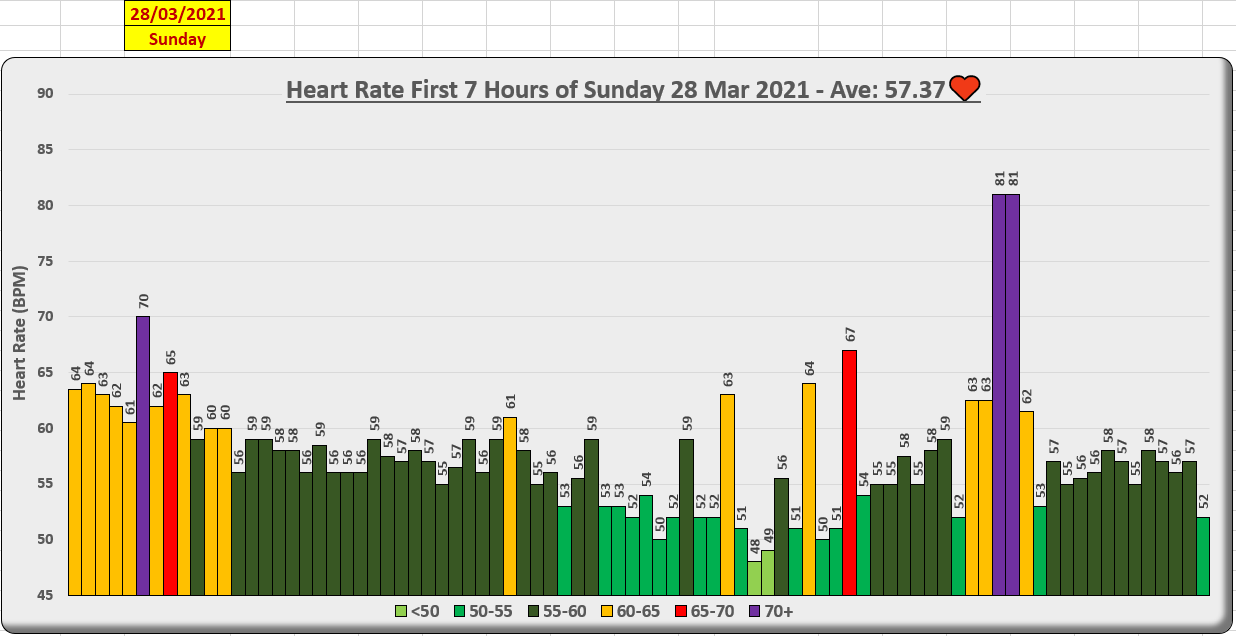
I added a drop down list so that dates within the available range could be selected to fill cell R2 which is then picked up by the filter to populate the chart with data.

I also added a dynamic title to the chart so that it could display the date of the data being displayed together with the average heart rate during the 7 hours:
=CONCAT(“Heart Rate First 7 Hours of “, R3,” “, TEXT(R2, “dd MMM yyyy”), ” – Ave: “, TEXT(AVERAGEIF(B:B, “<7”,C:C), “0.00”), “♥”)
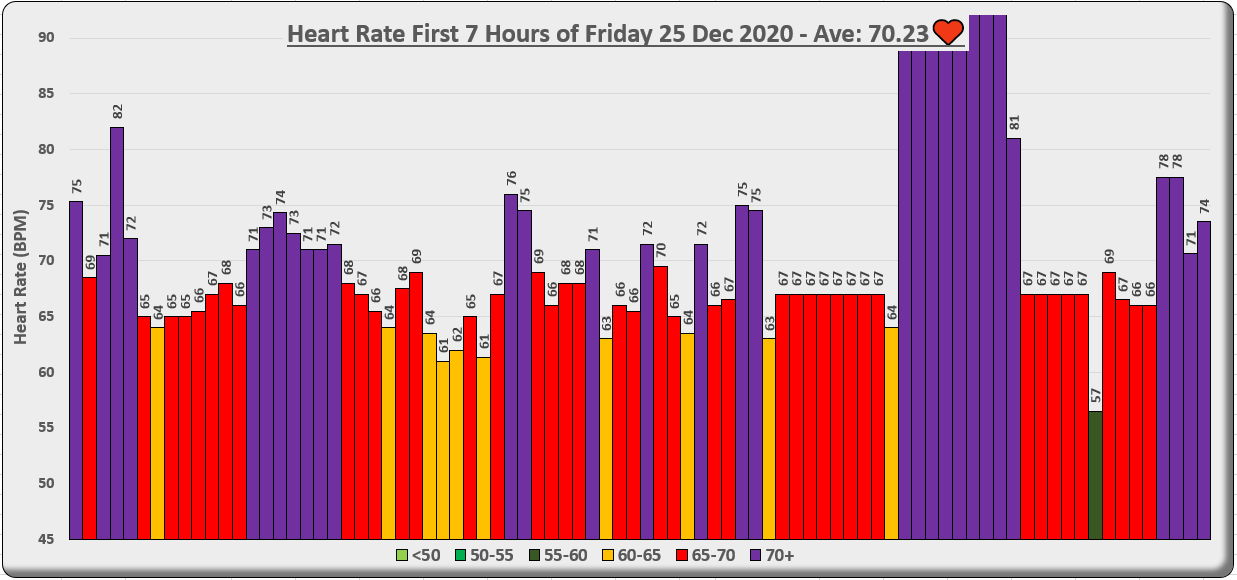
Now I can quickly visualise, analyse, and compare different days to see what my heart rate was doing during my sleep. Below is the chart for Christmas Day as my body struggled to digest the late Christmas Eve consumption forced upon it.
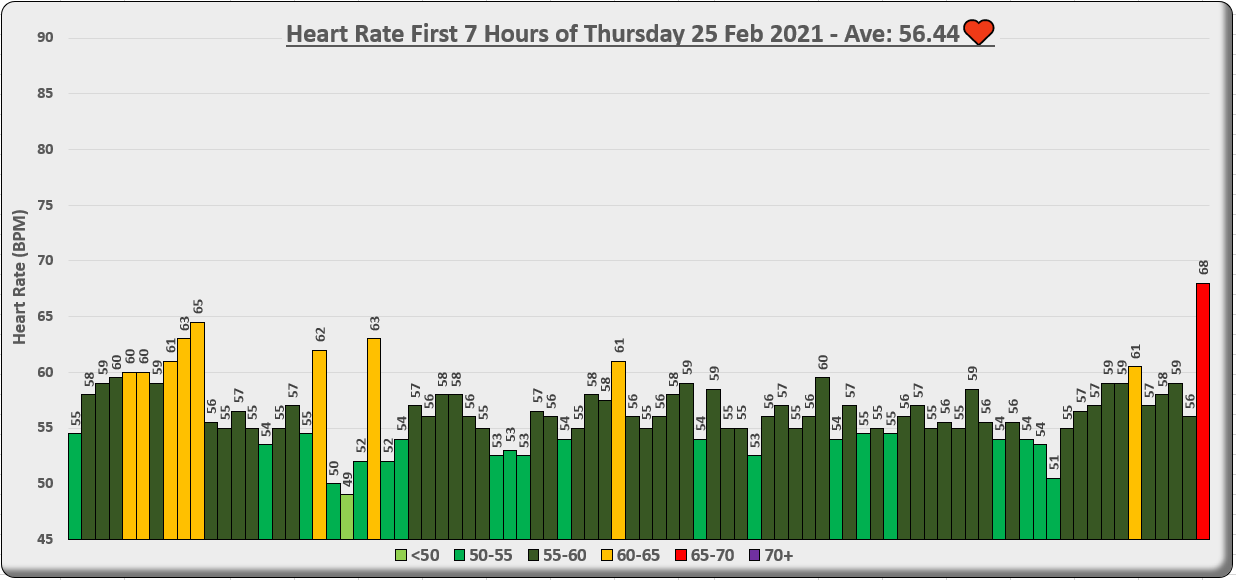
…and here is a much healthier example from 25th February 2021 with my lowest average heart rate (56.44 BPM) for the hours 00:00-06:59 recorded during the last 6 months.
Some time soon I will use a similar method to visualise my heart rate readings for all of my runs (http://www.neilmcniven.co.uk/category/running/).