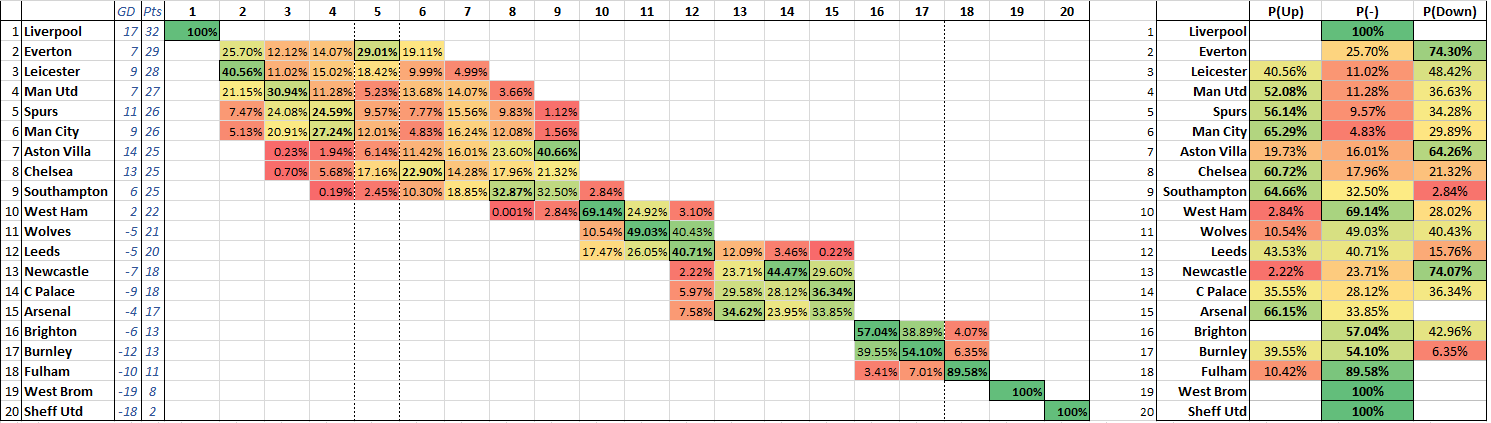
Pictured above is a chart which shows the estimated probabilities of the league position of each team after a round of matches – in this example Round 16 of the English Premier League at the end of 2020.

* Liverpool, then top were leading Everton by 3 points with a 10 goal goal difference advantage are shown as 100% likely to retain top spot, but this is rounded up from the calculated 99.999%. They did retain top spot.

The above table shows the probability of each team finding itself moving up or down the table, or staying in the same position after the completion of the round of matches.
The probabilities of each team winning, losing, or drawing a match are calculated using the latest match result odds from Betfair Exchange normalised to total 100% (because of the typical 101-105% over-round for Premier League matches).
The probabilities of each possible goal difference outcome depending on the odds of victory for the home team (Hodds) were calculated by taking 10 years of Premier League match data 2009-2019 inclusive (available here https://datahub.io/sports-data/english-premier-league as downloadable CSV files), and binning the data. (The betting odds in these files were those from Bet365 at the time of match kick off.)

With the probabilities for each match result and probabilities for the goal differences, the round of matches was simulated 250,000 times in Excel (VBA) to find pretty much every possible outcome for the league table and therefore the likelihood of each team finishing in each given position in the table.