Apparently the Drunkard’s Walk, “falls into the general category of Stochastic Processes, specifically a type of Random Walk called a Markov Chain.“.
That all sounds very complicated, so I’ll simulate it with an Excel Data Table. A drunk person starts at home at co-ordinates (0,0), and goes for a wander. For each step he takes, he can move in one of four different directions, East, West, North, or South, and he is equally likely to step in any one of those directions.
So, after taking one step, he could find himself at co-ordinates (1,0), (0,-1), (-1,0), or (0,1), so he will be one unit distance away from home. If he staggers 100 steps, how far from home is he likely to be?

To simulate this, I made the rule that a random number between 1 and 4 decides the direction of step of the drunkard. A 1 for example increases the x co-ordinate by 1 – a step to the East, a 3 increases the y-co-ordinate by 1 – a step to the North.
As shown above, multiple steps are randomly generated, the (x,y) co-ordinates of the drunkard after each step are displayed, and then Pythagoras’ Theorem is used to calculate the distance of the drunkard from his origin (0,0).
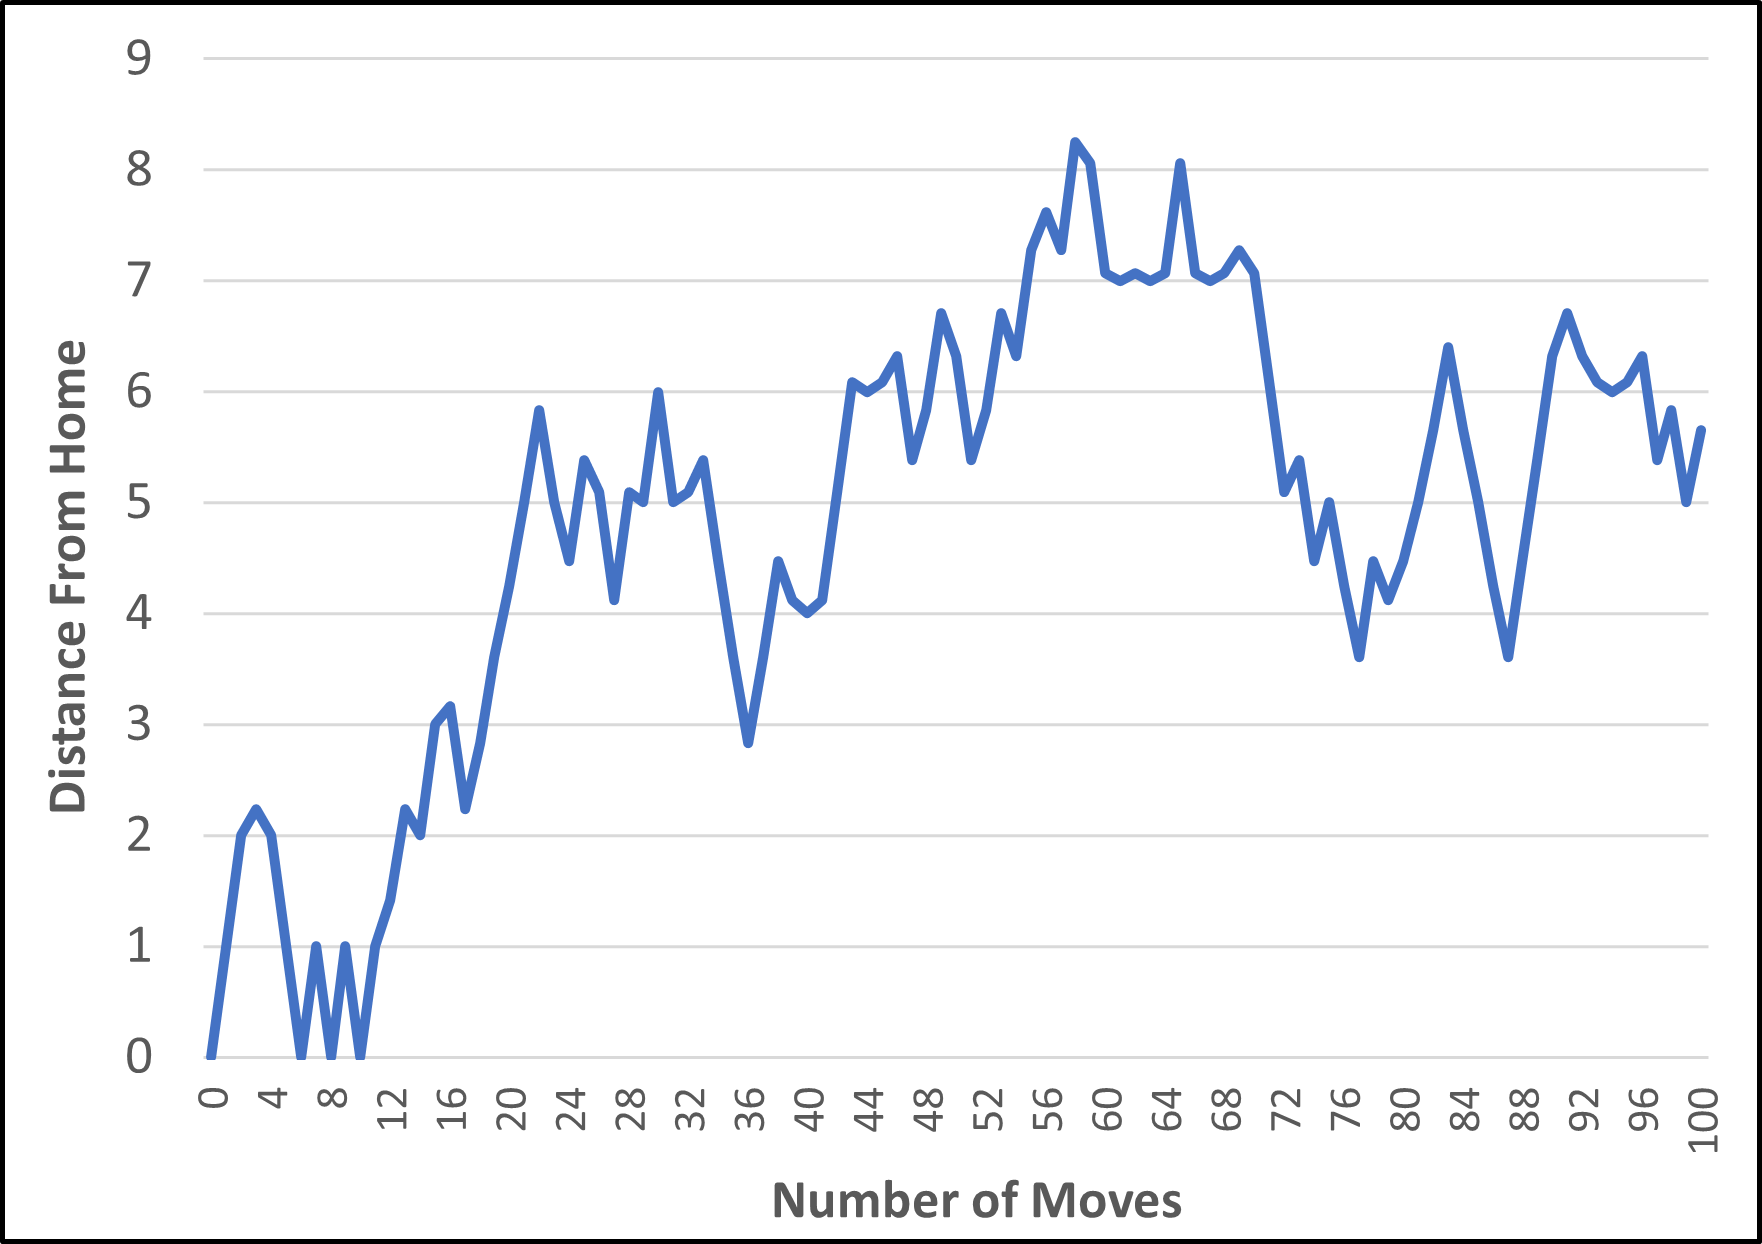
Above is an example of how far the drunkard could find himself from home after taking his 100 random steps. He ends up almost 6 step lengths from home.
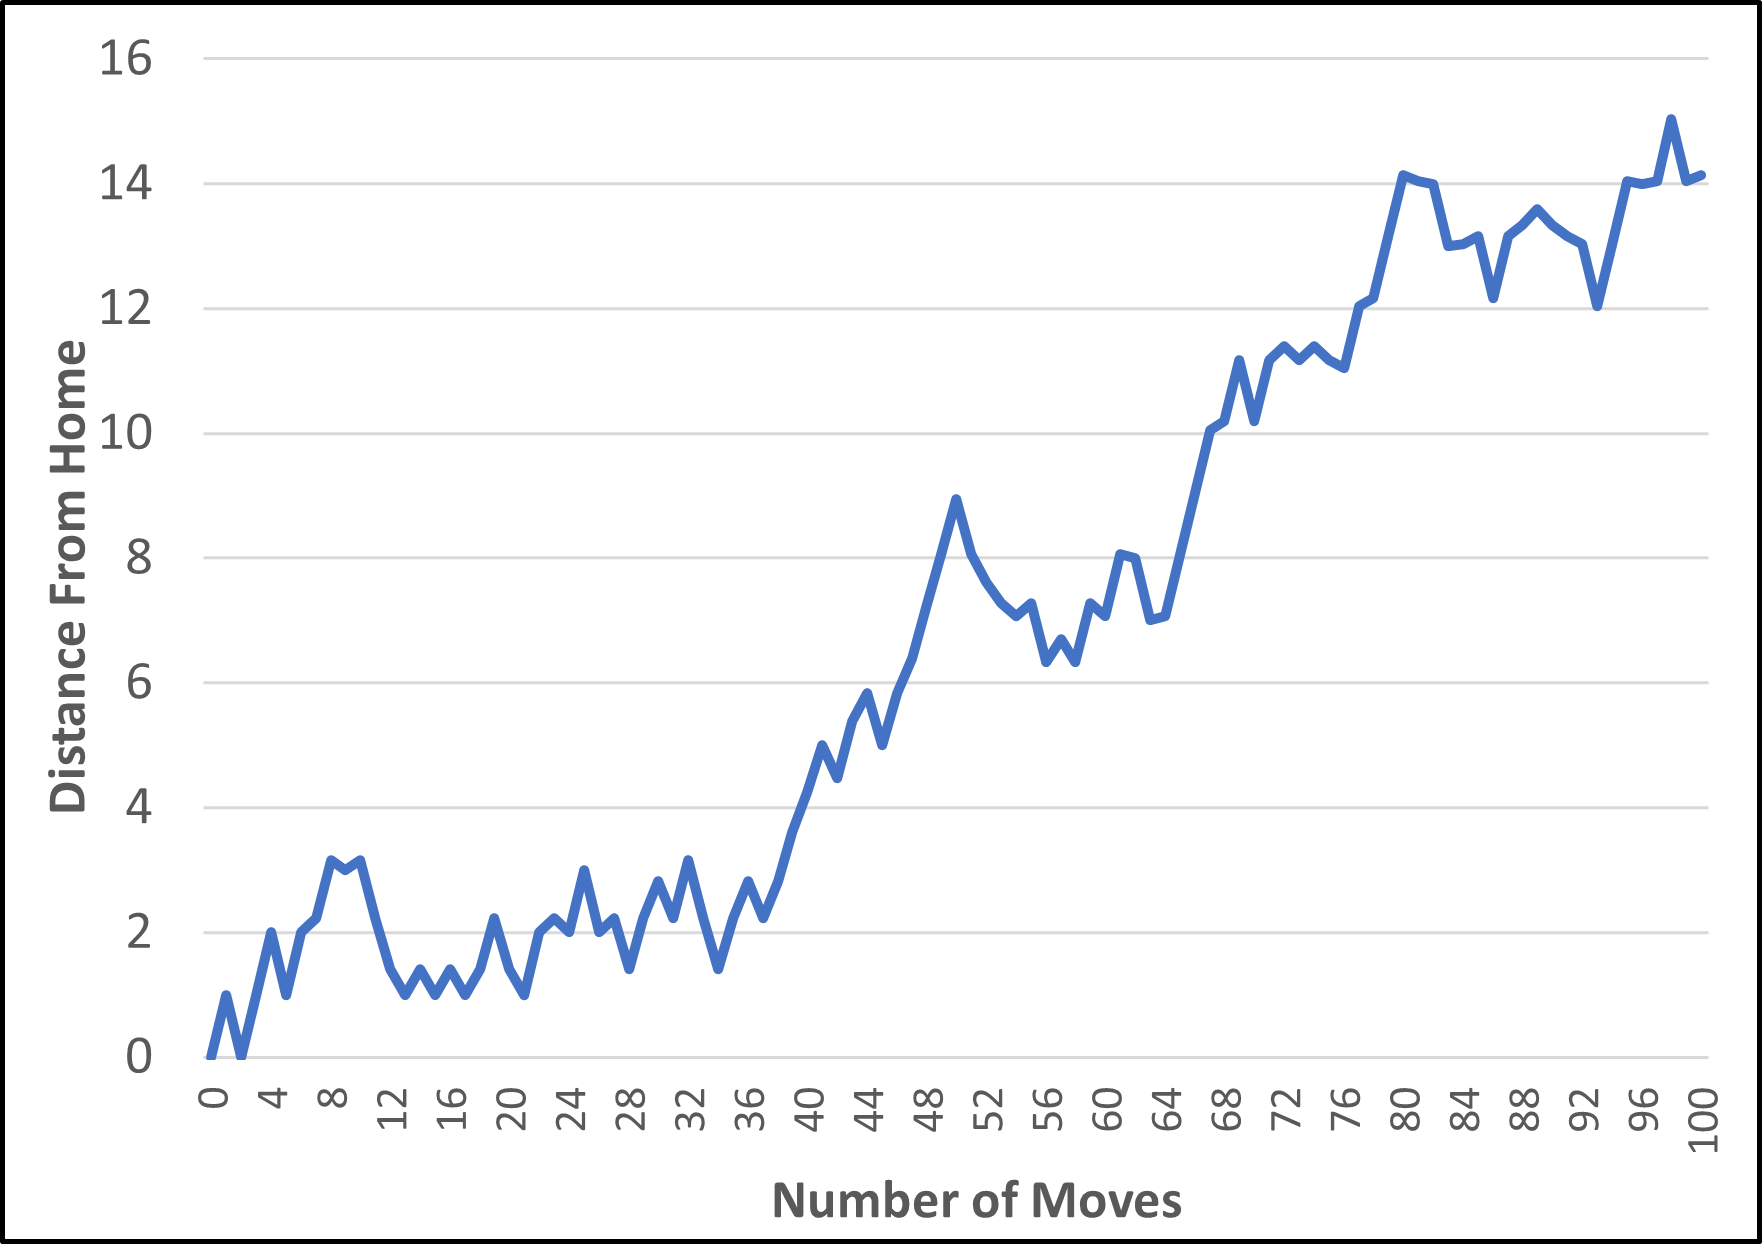
Here is an example where he ends up over 14 step lengths from home.
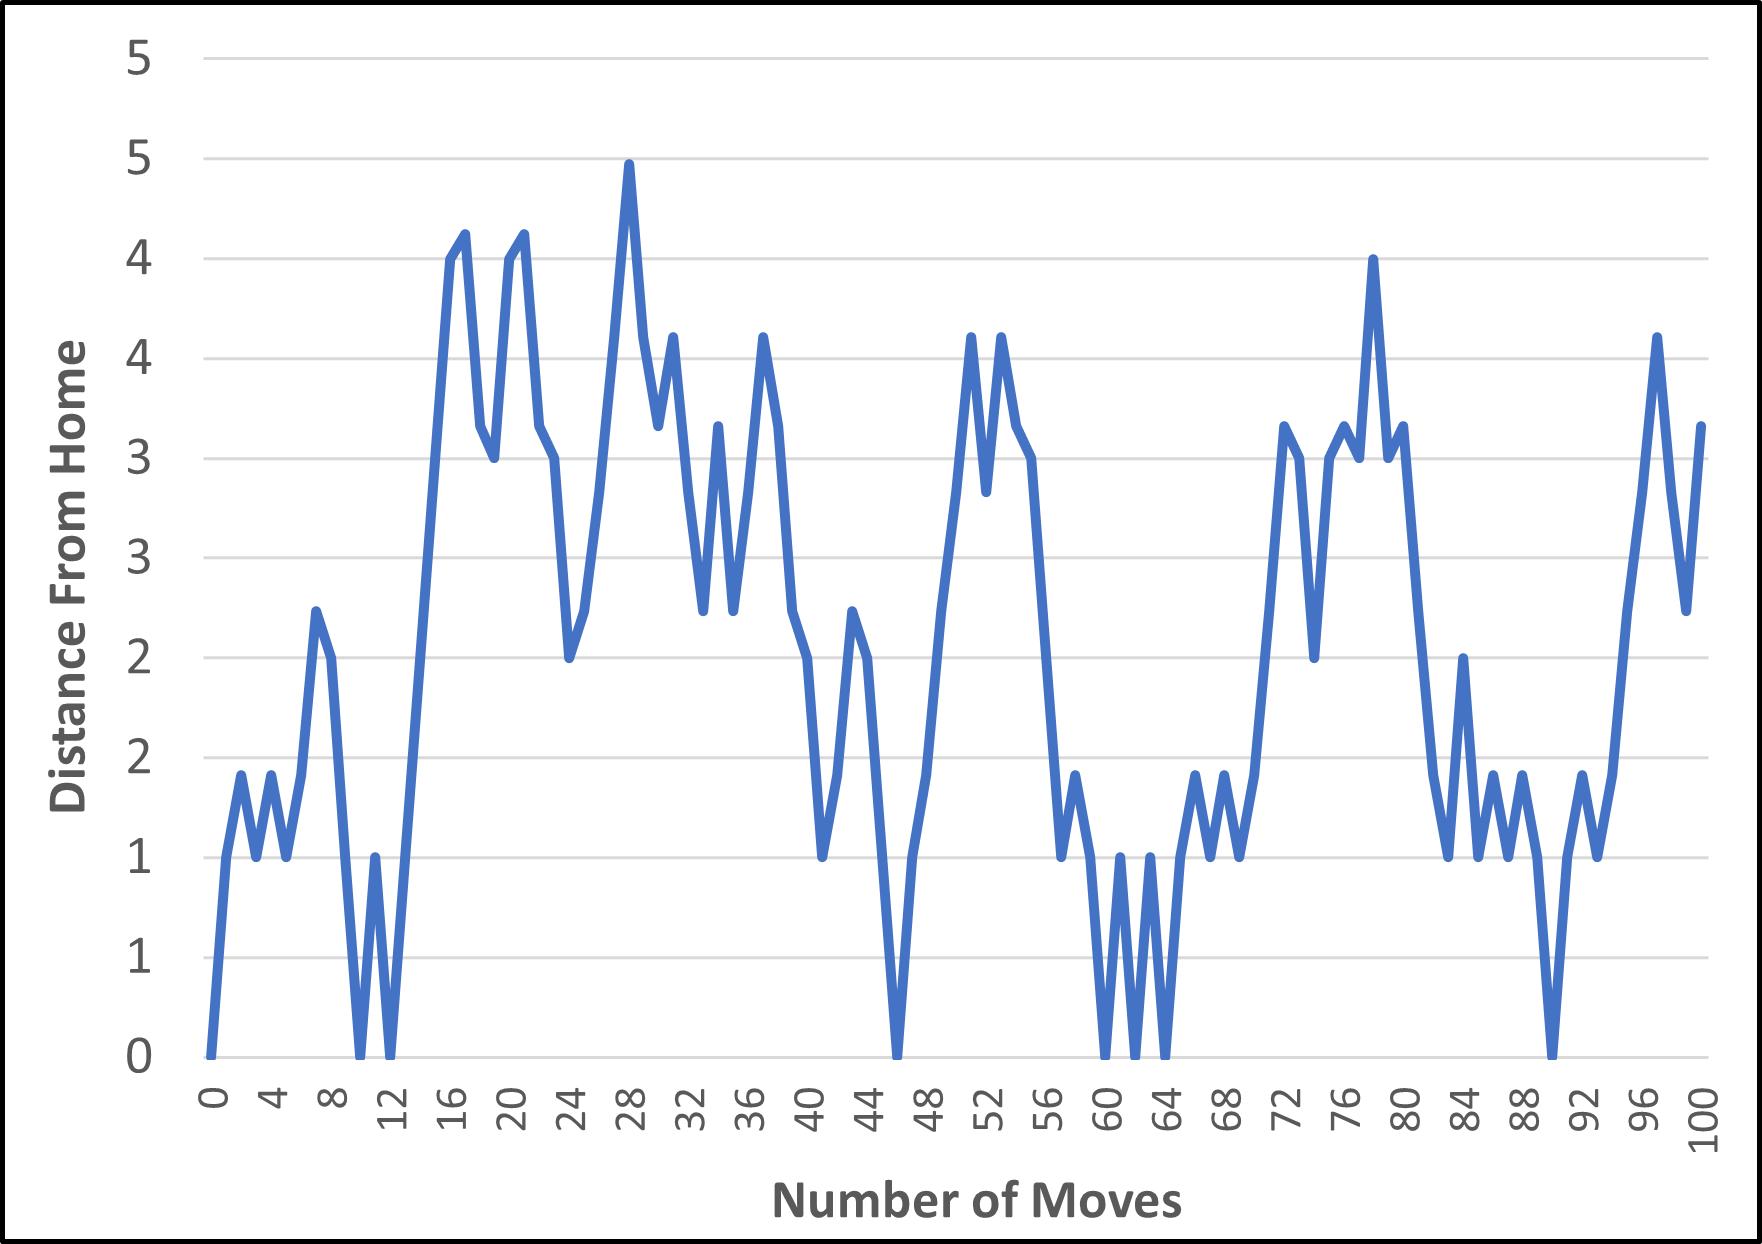
In the last example, pictured below, he finds himself back at home on 7 occasions during his 100 steps, but finishes up 3.5 step lengths from home.
Rather than continuing to manually refresh and send the drunkard out on yet another walk, I simulated 10,000 walks using a Data Table in Excel.

The results look somewhat Poisson Distributionish, but it is very noticeable that for 100 steps, the likelihood of the drunkard ending up between 4 and 5, 5 and 6, 7 and 8, and 8 and 9, are each almost double that of him ending up between 6 and 7….and this is always reproduced when re-running the simulation. Ending between 9 and 10 is also much less likely than between 8 and 9, or 10 and 11.
Further analysis required.
From another run through of the simulation, it was found that the maximum distance the drunkard found himself from his origin after 10,000 walks of 100 steps was just over 30, the mean distance was 8.86, the median distance 8.25, and the standard deviation of distances reached was 4.61.
Multiple further run throughs resulted in very similar figures.
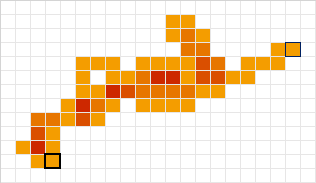
The next step is to visualise the path followed by the drunkard.

Above is one such example. Starting at (0,0) represented by the square with the thick black border, the drunkard took 100 steps and found himself at the dark blue bordered location. The more red a location, the more times it was visited by the drunkard.
Sometimes he does not get very far away from home at all.

And other times, he gets quite far away.
Let’s look at which locations are passed through the most often by the drunkard on 1,000 of his walks.
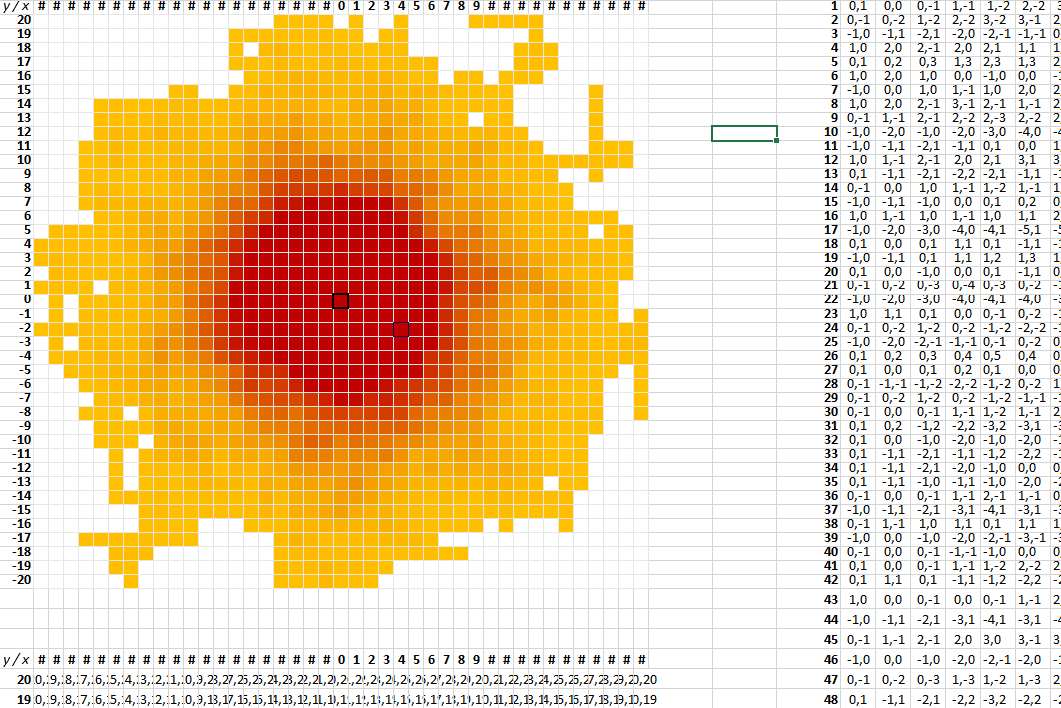
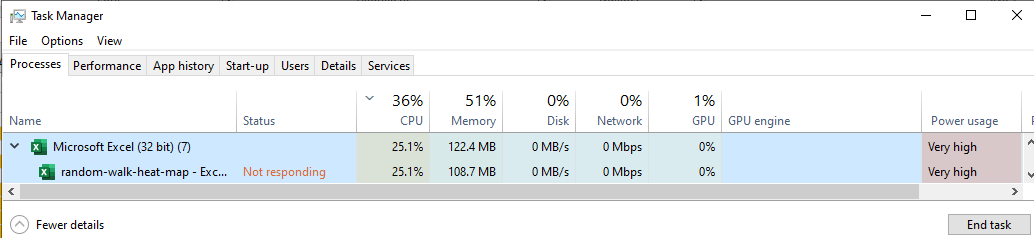
As it took one minute to visualise the locations visited by the drunkard in just 30 walks (pictured above), it looks like a) Excel is struggling with this large data table and its 100,000 countifs, and b) I should have used VBA.
It does however look like the locations visited by the drunkard are very symmetrical around his origin.
Looking at where the drunkard can finish up with 10,000 walks of 100 steps:

…and this explains why the distribution of distances from origin was so lumpy. With 100 steps, it is apparently impossible to finish in any location with an odd value of x or y (but he CAN finish up with a location with an odd value of x AND y).