Below is a chart to showing the percentage of positive Covid-19 tests in the UK each day for 1st October 2020 to 17th January 2021.
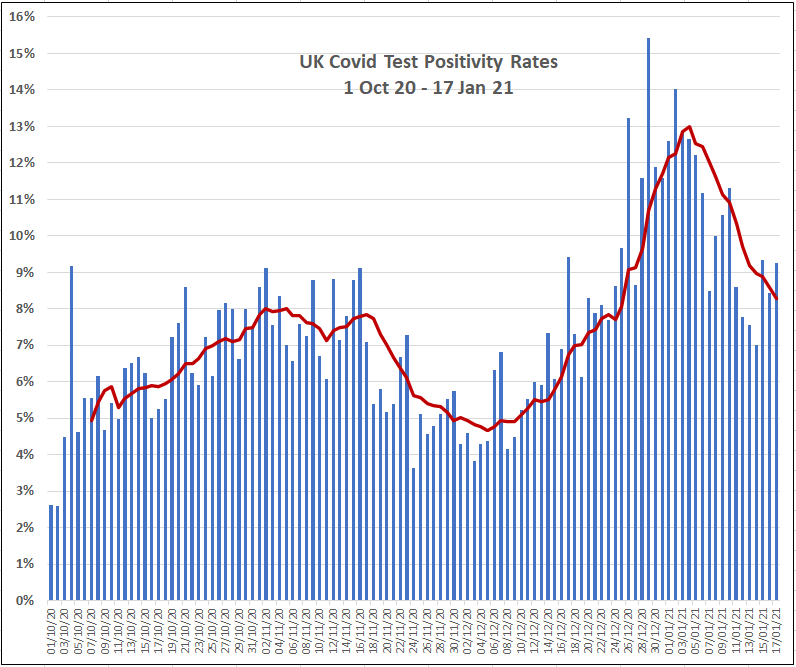
The red trend line shows the 7 day rolling average test positivity rate.
The first downward slope shows the effect of the second national lockdown, followed by a steep peak upwards following the end of lockdown and the new and more transmissible Kent Covid19 variant.
The third national lockdown starting in late December finished that peak in test positivity at around 13%, and it has subsequently dropped to around 8-9% as of data reported today (19 Jan 21) of tests and results up to and including 17 Jan 21.
[Raw testing and cases data sourced from the UK Coronavirus Dashboard]
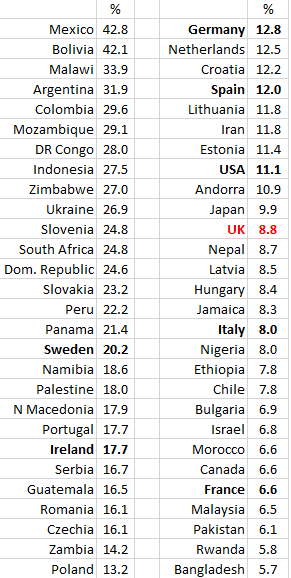
The table above shows Covid test positivity for countries worldwide over the last couple of weeks. Selected countries are in bold for comparison with the UK.
[Raw data sourced from OurWorldInData.com]