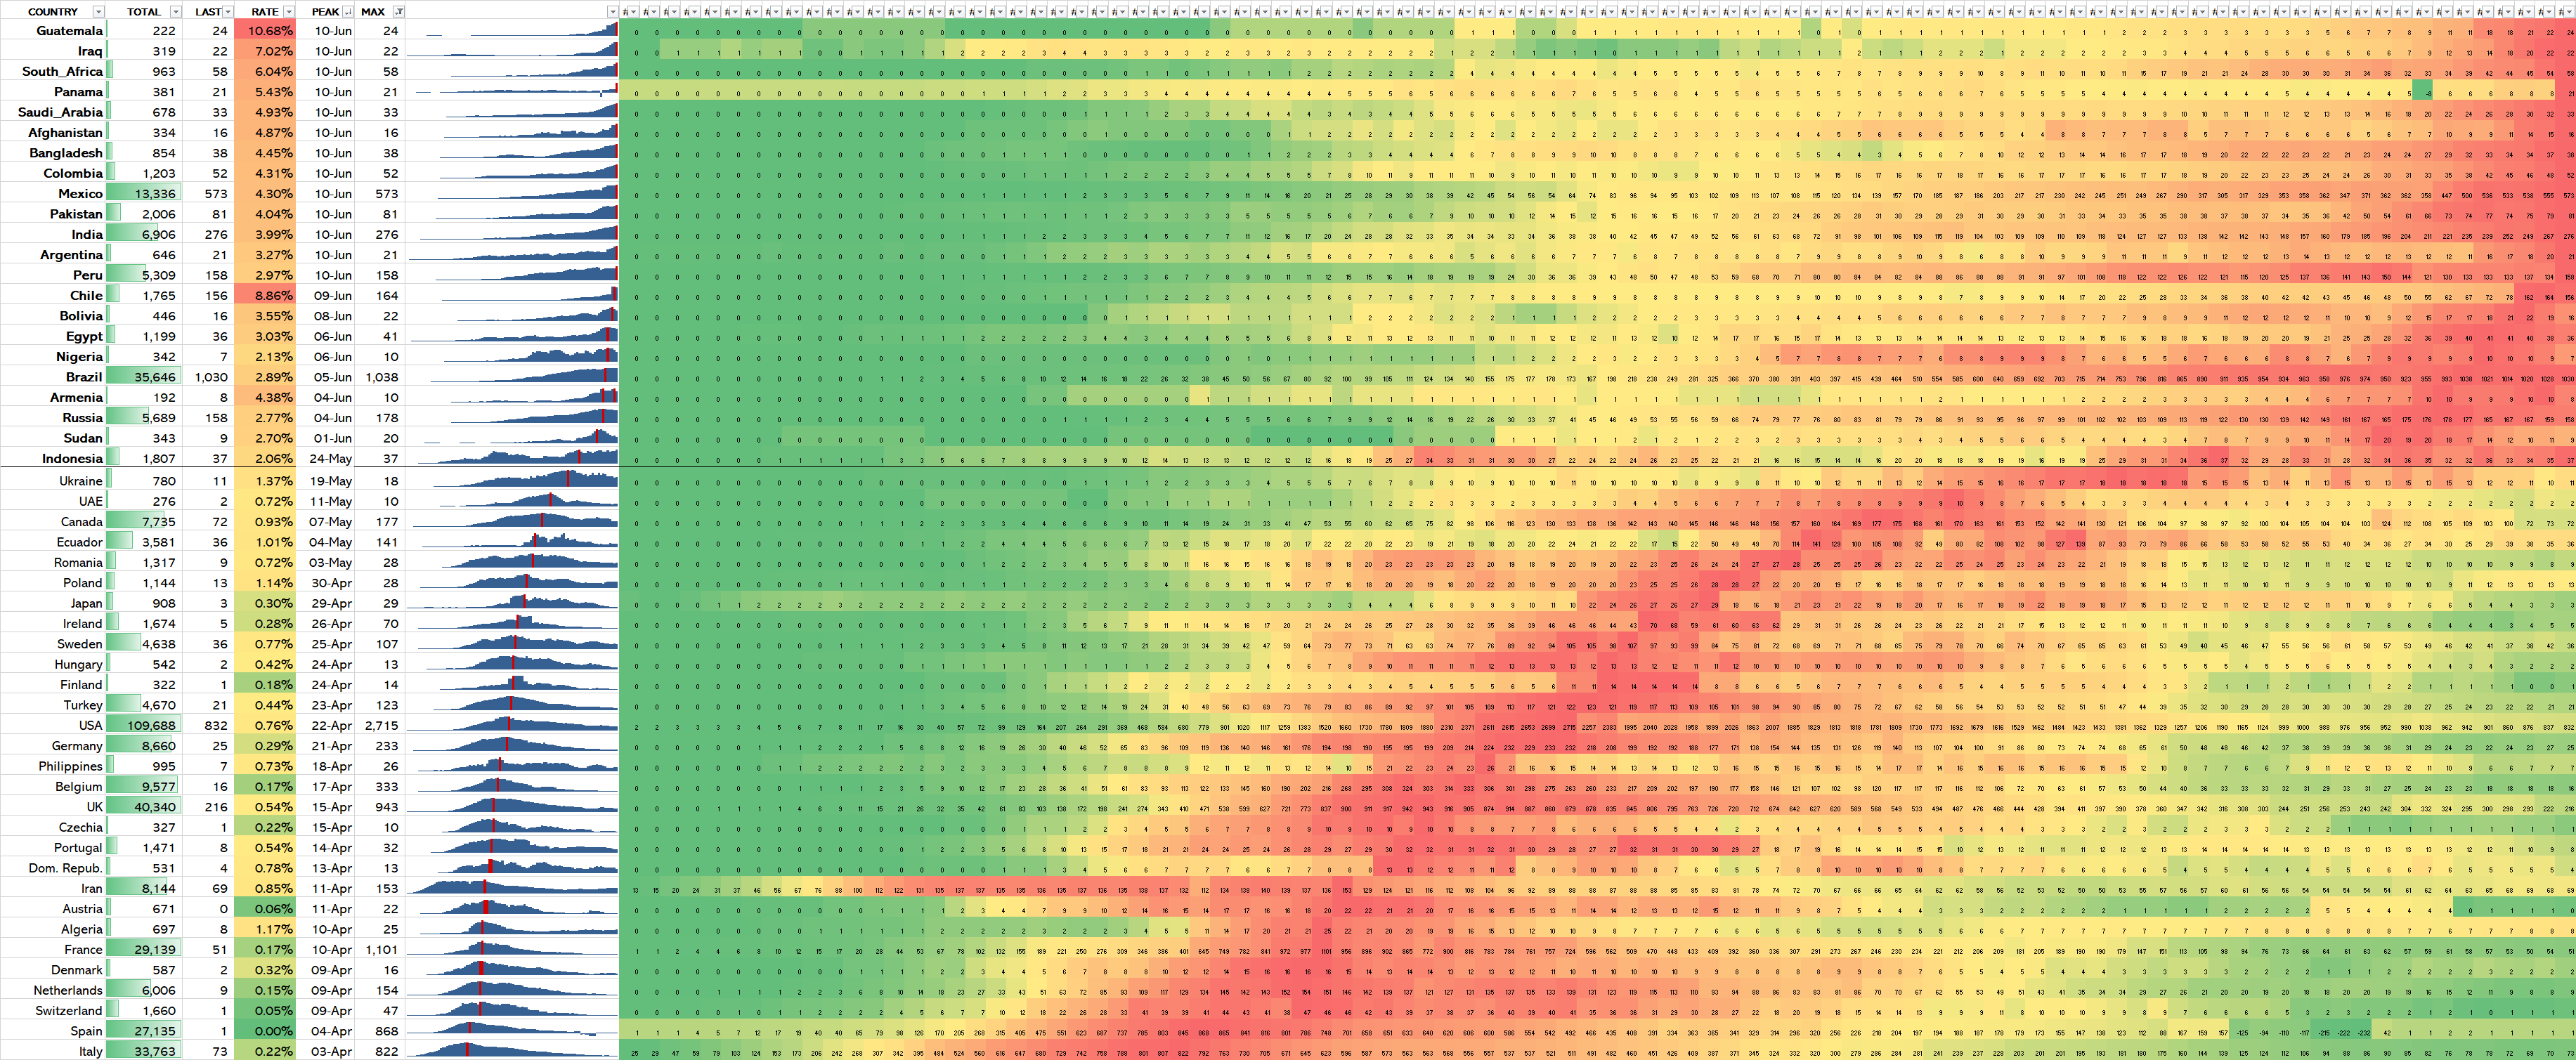
The chart below shows where different countries are on their Covid-19 trajectory in terms of deaths suffered.
It shows the country name, total Covid deaths reported since the start of the pandemic, the deaths reported on 10th June, what percentage of the total that daily number is, the date of their highest daily death report, and the number of reported deaths on that date.
Click on the chart to make it full size to view in detail.
[Raw data sourced from https://www.europeandataportal.eu/]
The table is sorted first by date of peak deaths, and then by the growth rate of daily deaths.
Countries in the top 1/3 of the table have not yet reached their peak, and their daily growth rates are 2-10%. A daily growth rate of just 2.5% means that the total deaths recorded by a country will double in just under a month.
A continued daily growth rate of 4% would see total deaths doubling from their current value in just 2.5 weeks. If India (3.99% daily growth rate) for example continues on its current trajectory, it’s total deaths due to Covid will increase by over 7,000 before the end of June.
The above results would be more accurate and useful if I had used a 7-day rolling average as different countries report deaths inconsistently through the week, but it is adequate for a rough and ready overview.