Below is my running record for the year 2020. Click on the larger chart images to better see the details.
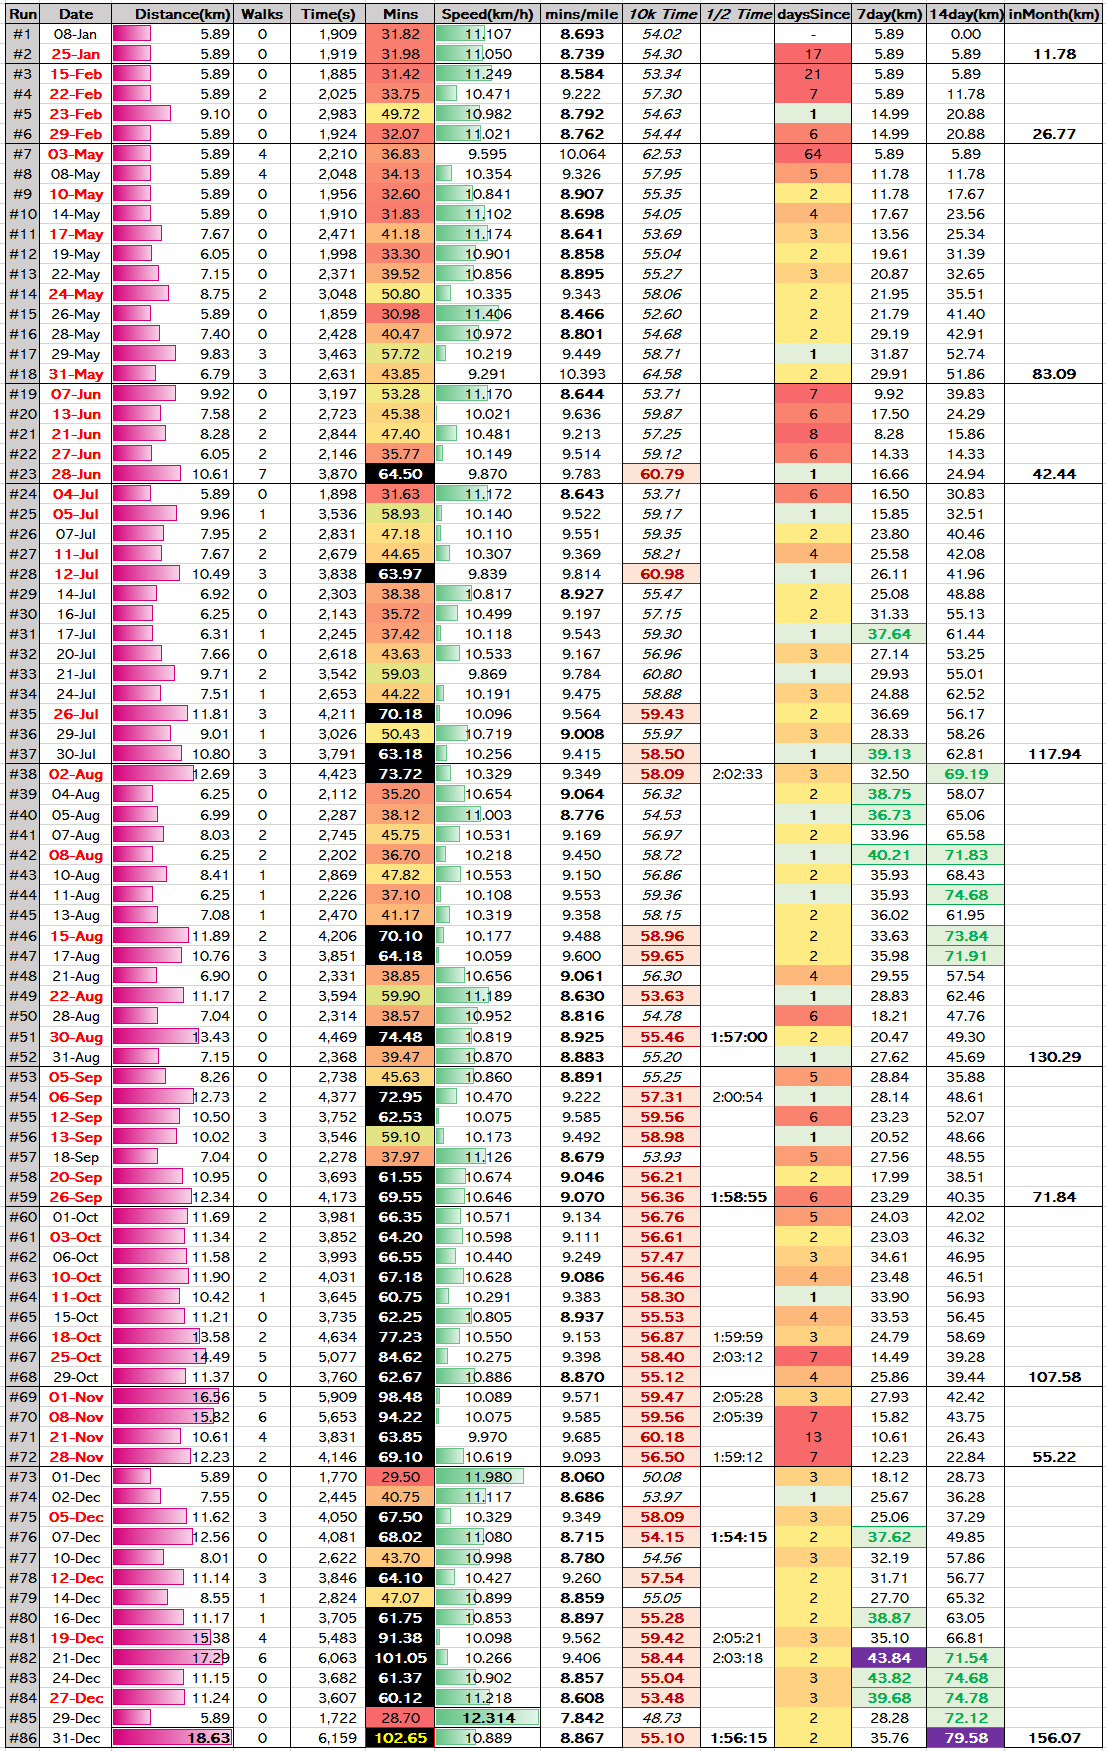
- Dates in red are Sundays.
- Walks is the number of walking breaks taken during the run.
- All times in minutes are given as decimals – e.g. 60.75 minutes would be 60 mins 45 seconds.
- mins/mile is the pace of the run (minutes per mile) – in bold if sub 2 hour half marathon pace.
- 10k Time is either interpolated or extrapolated from the average run pace – times in red are where more than 10k was run and so could have been faster if only 10k had been run.
- Extrapolated half marathon times (1/2 time) are given for all runs over 12k – in bold if below 2 hour pace.
- 7day and 14day give the total km distance run over the previous 7 or 14 days respectively (where that day’s run counts as day 1). The top 2nd to 10th ranked distance for each category is in green, with the top ranked purple filled.
- daysSince shows the number of days since the previous run.
- Runs exceeding one hour in duration have a black fill for their Mins (run duration in minutes).
Below is a summary of the 86 runs of 2020 showing the Distance, Time, and Speed rankings for all runs. Again, click on the image to view in detail.

- Distance – the rows which show run distance in km in descending order. Those with a yellow (or red) background were runs without walk breaks.
- Time – the rows which show run durations in decimal minutes in descending order. Again, yellow (or red) background were no walk break runs.
- Speed – the rows which show the run speeds in km/h in descending order – i.e. fastest first.
The three rows in blue below the Speed row give the distance, number of stops (aka walks) and the date of the run which resulted in the speed shown above. For example, the fifth fastest run of the year was 11.28km/h over 11.24km with no walks and took place on 27th Dec 2020.

The table above shows the day of the month horizontally and the month of 2020 vertically to compare total distance progression through each calendar month. For example, the top 3 distances achieved by the 8th of a month were 40.21km (Aug), 37.62km (Dec), and 34.61km (Oct). Top rank is in bold.
The table below shows the 36 10km+ runs of 2020 ranked by speed.

Here are the average WMA age-grade scores (details: http://www.neilmcniven.co.uk/comparing-the-quality-of-timed-runs-of-different-distances/) for the runs of each month of 2020.

and here are the top 20 rated runs of 2020.

Finally, here is a bubble chart to show the 10km pace of every run in 2020 with the size of the bubbles representing the distance of each run.
