ESPN have scorecards online of every test cricket match ever played, but unfortunately not in a very easy way to download and analyse offline. They have one webpage per calendar year – for example for the year 1946, the URL: https://stats.espncricinfo.com/ci/engine/records/team/match_results.html?class=1;id=1946;type=year, gives the page that has a list of the test matches played that year.

For each Test match played, there is a link to a numbered Test Scorecard – for example, Test #276 is the match between England and India. Clicking that link or using its URL: https://stats.espncricinfo.com/ci/engine/match/62662.html brings up the corresponding scorecard:

Every match has its own ESPN match ID. Test match #276‘s is 62662, which is the number in the URL for the scorecard. So, by visiting the test match results pages for every year and getting the match ID number for every listed match for that year, you can build up a list of URLs for the scorecards of every cricket test match ever played.
When I completed this task this added up to the 2188 test matches played since the Second World War. (I was not so interested in the pre-war matches.)
Writing a web scraper in PHP and using it to download the contents of all 2188 scorecards, and then extracting from those the teams, scores, results, falls of wicket, and so on would probably have contravened the terms of use of the ESPN Cricinfo website, so I of course did it all manually with a pencil and notebook and then typed the data into an Excel spreadsheet.
The data accumulated required further processing to separate everything out and identify matches where the 2nd team to bat was forced to follow on, could have been forced to follow on, declarations, which team batted first, was a victory by runs or by an innings or by a number of wickets, etc. This was all completed in Excel, building a few worksheets.
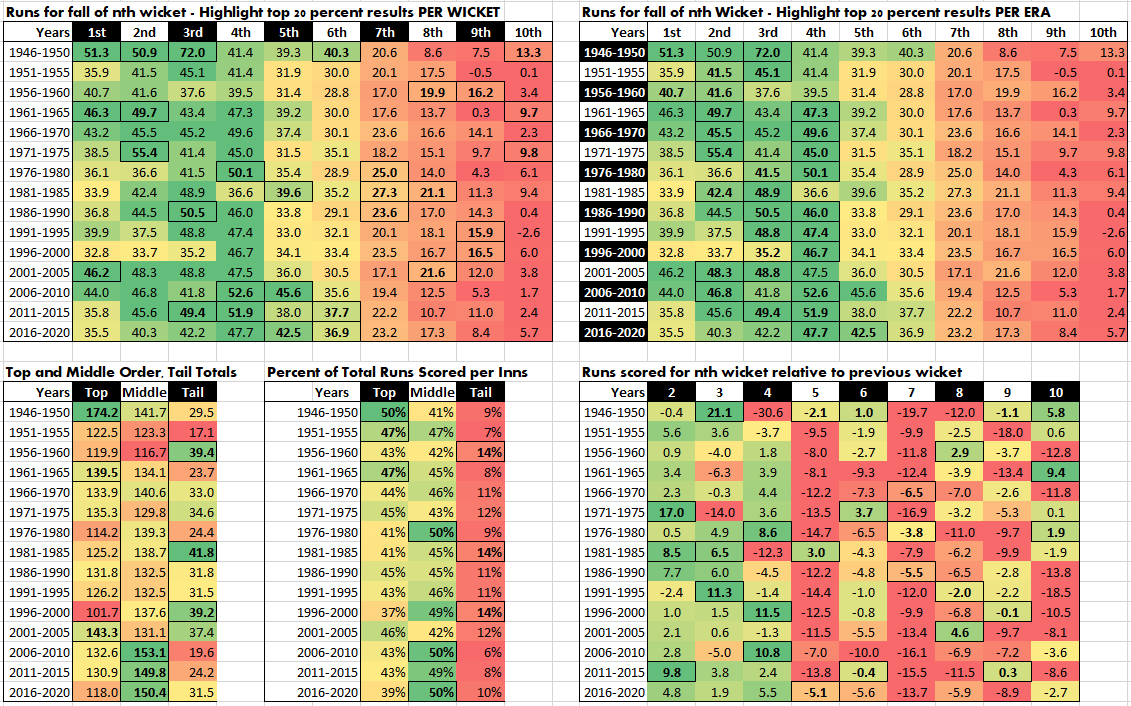
Below for example is the fall of wicket worksheet I ended up with. Click on the image to view in full-size.

This data can then be further processed and visualised as shown below.

With all the data at your fingertips it is also possible to very quickly answer any burning questions you may have. For example, which post-War test matches were played over the most overs?

606.9 overs (aka 607.3 overs*) for match 62710, the scorecard for which will be https://stats.espncricinfo.com/ci/engine/match/62710.html if you want to find out more about that match.
* The third match in the table above for example had 133.3, 216.3,197.4, and 40 over innings. That is 133+216+197+40 = 586 plus 3+3+4 = 10 balls, or another 1 over and 4 balls for a grand total of 587.4 overs, and not the 587 overs shown in the table. A little additional processing is required!
Or…how many wickets were taken on average per match during different eras.

Or…how many runs are scored on average per test match?

Returning to fall of wicket statistics, the tables below show the average fall of wicket scores for wickets 1 to 9 across different eras for the team batting first. The top table shows the fall of wicket scores below which the expectation is that the team opening the batting will lose, and bottom table shows the fall of wicket scores above which the expectation is that the team opening the batting will win.

Obviously these tables don’t take into account which teams are playing, where they are playing, weather conditions, pitch conditions, and a million and one other factors, but it is interesting to look at how the values changed through the years.