I ran a Monte Carlo simulation of coin tosses with Excel – simulating tossing a fair coin 20 times to see how many times the coin landed on heads, and repeating that 50,000 times.
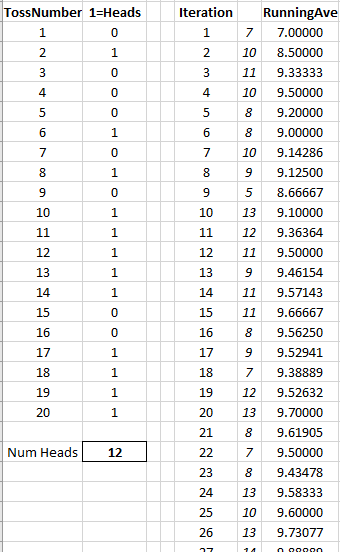
Above on the left shows one iteration of tossing the coin 20 times. On this occasion, heads (1) came up 12 times, and tails (0) therefore 8 times. (The coin toss is just a randombetween(0,1) Excel function call.)
Above on the right shows the simulation which uses a 50,000 row data table (see here for a tutorial on using this method for simulations with Excel: https://excel.tv/monte-carlo-simulation-excel-tutorial-download/.
The contents of the generated table can then be analysed.
The table below shows the number of times N heads came up when the coin was tossed 20 times. For example, on 755 occasions, there were 15 heads when tossing the coin 20 times. On one occasion of the 50,000, heads came up 20 times out of 20, and twice there was just 1 head from 20 tosses.
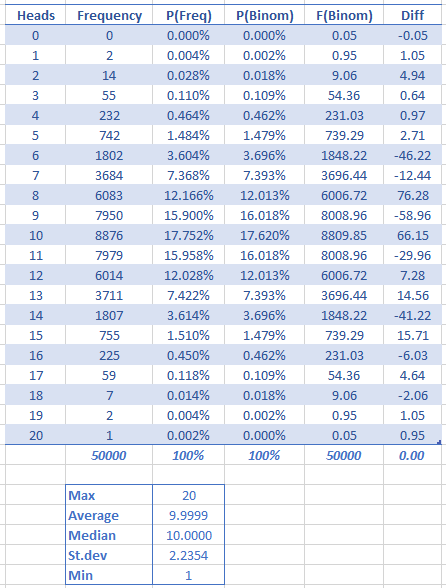
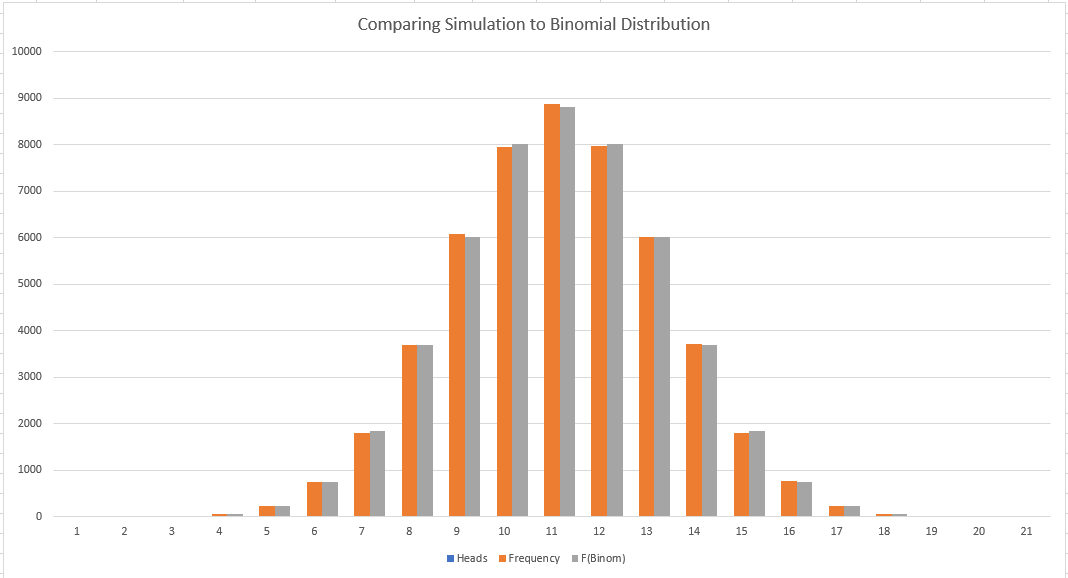
The probability of seeing N heads from 20 coin tosses is modelled by the binomial distribution, so in the table above I have calculated the expected frequency of different number of heads to compare with the results output by the simulation.
The distribution in the simulation is shown below side by side with what we would expect to see from the binomial distribution.
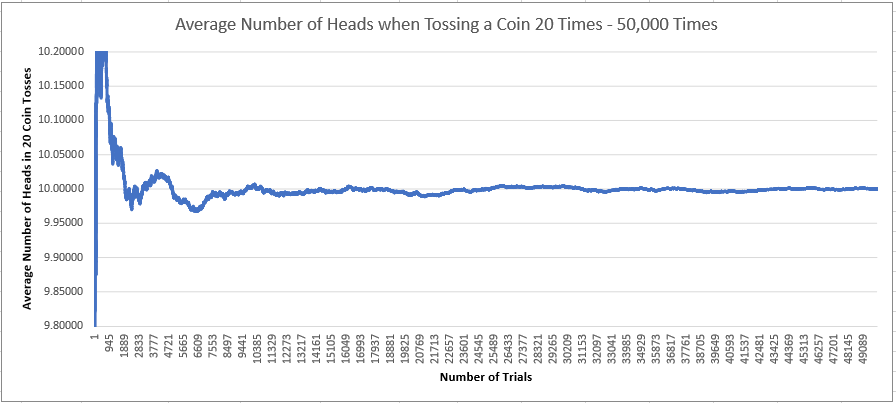
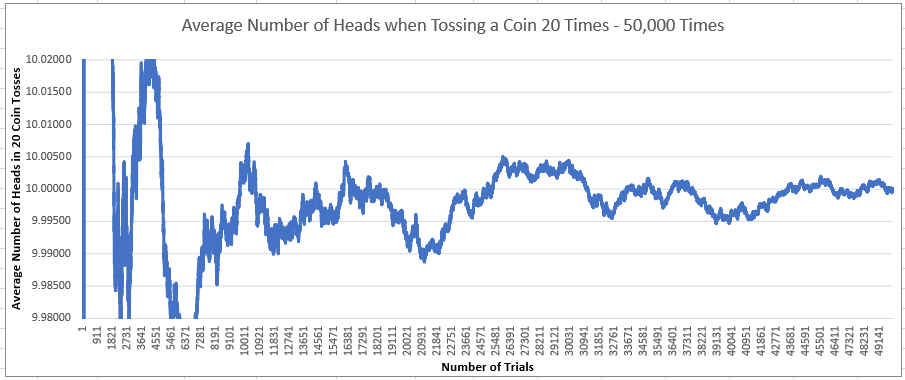
The charts below show how the average number of heads seen when repeatedly tossing a coin 20 times gets closer and closer to the expected mean of 10 heads the more trials we do. (The bottom chart is zoomed in x10 compared to the top chart.)