Having previously read in the BBC weather forecasts from the web using Power BI, today I attempted to read in and process the latest betting odds for the next 14 matches of Premier League football from https://www.oddschecker.com/football/english/premier-league.
Initially it seemed like a very simple task, but then it turned out that the oddschecker.com sometimes changes their table layout adding extra icons such as the TIP one pictured below which messes up the pre-processing steps which previously worked.

Power BI with Power Query can grab the web page and it suggests a collection of different tables of data which may be of interest.
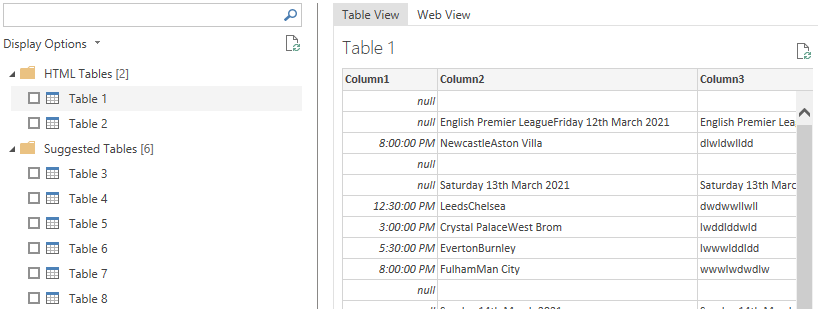
All the information was there by using a combination of tables, but no one table had it all. In some tables the team names were stuck together without a delimiting character, in others some of the odds were missing or the data was shifted horizontally by a column or two half way down the table, and in others some of the teams’ names were abbreviated (e.g. C Palace instead of Crystal Palace, Sheff Utd instead of Sheffield Utd).
I added columns to calculate the decimal odds and implied probabilities (taking into account the calculated over-rounds) for each match in the table which held the cleanest data. I then added a column to another of the tables which showed the team names in separate columns – a column which would concatenate the two team names together in the same way that had been found in the ‘clean’ data table.
This new Team1Team2 column could then be used as a key to set up a relationship between the two tables (using Modeling > Manage Relationships). With that it was possible to associate match odds and probabilities with individual teams and their matches.
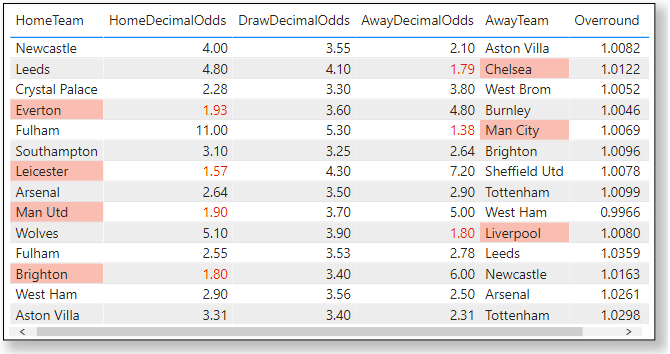
Above are the upcoming matches with some highlighting to show any odds-on favourites for victory.
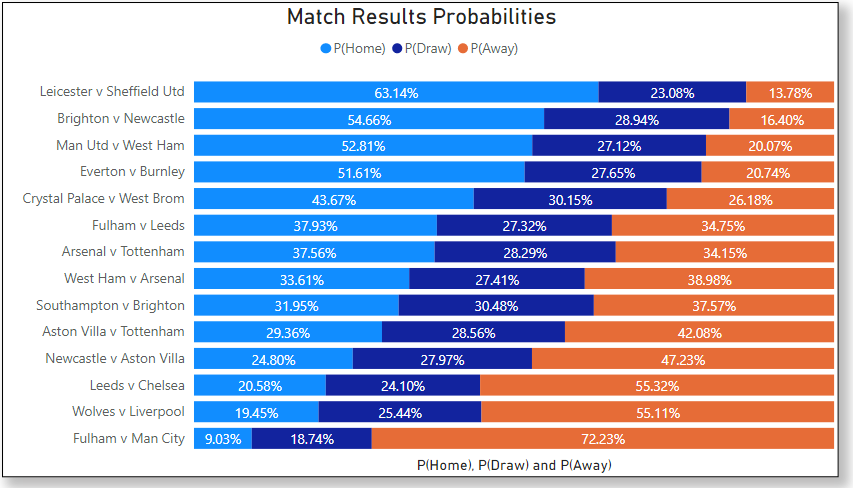
Below is a stacked bar chart of the probabilities of each possible match outcome, sorted on the chance of a home team win. The y-axis labels were generated in yet another column [Team1] & ” v ” & [Team2] for presentation.
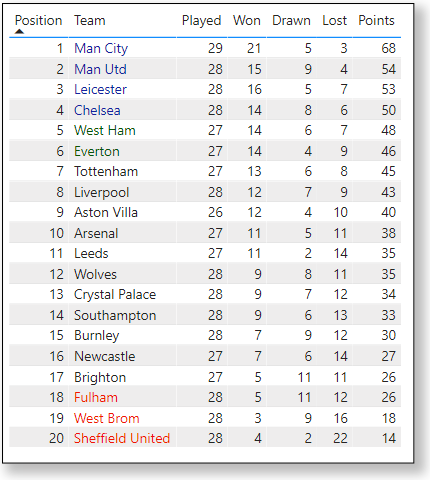
One table which Power Query had no problem picking up was the table containing the Premier League standings. This just needed to have the columns named – everything else had the correct data type and could be charted in Power BI without any problems. (I have added some conditional formatting to show the European and relegation positions.)