The international break is the perfect time to take a look at the state of the Premier League and the form of the teams with more than three-quarters of the 2020-2021 season completed.
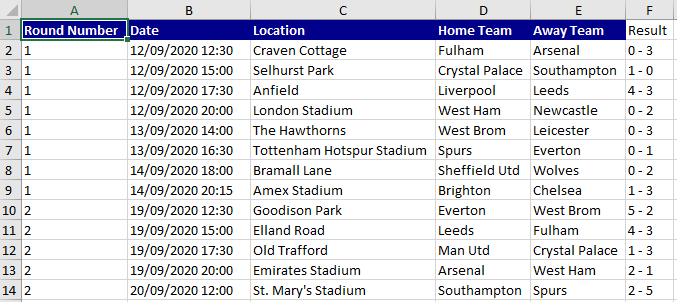
All match results and fixtures are available here: https://fixturedownload.com/download/xlsx/epl-2020, downloadable in Excel format. This file gives the round number, match date, match venue, the home and away team names, and the result of each match (if it has been played) with the home team score listed first.
I was interested in looking at the form of each team through the season so far. Most newspaper and other online sources of the Premier League table use a graphic to show the last five results for each team as shown below.
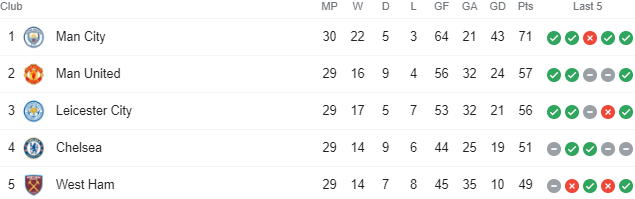
…but I wanted to see the form throughout the whole season in which the teams have all played around 29 matches so far.
In order to achieve this I generated some helper columns in the original Excel worksheet I’d downloaded.
Firstly, I added columns giving the result for the home (HR) and for the away (AR) teams (a 3 for the winner, 1 for a draw, and 0 for a loss) in each match by breaking up the string containing the match results – e.g. “0 – 3”, “5 – 2” into another two columns (H and A) to show the goals scored by the home and the away teams.
Then I used Excel Countifs to calculate a number to append to each team name in each match to indicate the number of matches each team had now played. Therefore, for example, Fulham’s first game saw their name changed to Fulham-1, for their second game their name was Fulham-2, and so on.

This quick and dirty method gave an easy way to uniquely identify the Nth match result for any team whether they were playing home or away.
I made a table with the [match] numbers 1-30 lying horizontally and the team names listed vertically, and then used xlookups on the table pictured above to make the visualisation pictured below to show the form of each team through the Premier League season so far.
I used conditional formatting to show green for a win, yellow for a draw, and red for a loss in a particular match. Matches not yet played were set to be NaN and then conditionally formatted to show in white with an X.
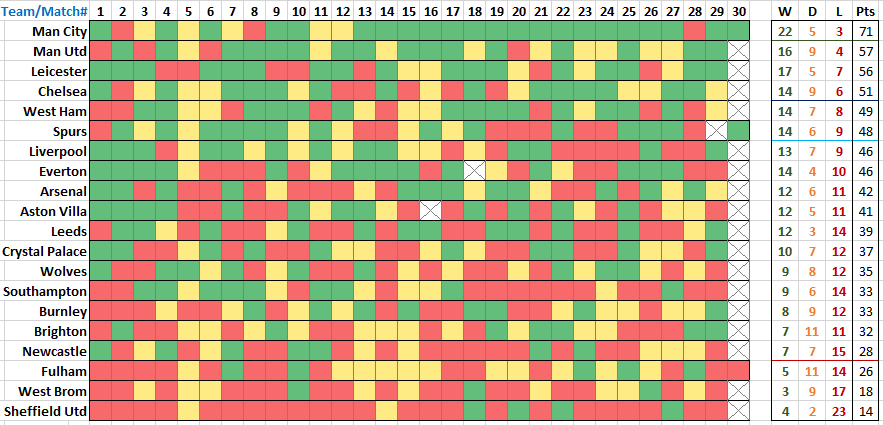
I added a summary to the right of the visualisation to show the number of wins, draws, and losses each team have had so far as well as the number of points they have earned.
It can clearly be seen that teams such as Man City and Sheffield have had a much better second half to their season compared to their first half, and teams such as Southampton and Liverpool have had a much worse second half to their season compared to their first half.