Continuing to look at Power BI, I decided to see how easy it is to import raw data from the internet in the form of web page tables, and get useful information visualised from it. I chose to use the BBC Weather website page for my location.

Six tables were automagically found on the webpage, with the first table containing the hourly weather forecast data pictured below, but in numerical form without the graphics.

I chose to Transform Data in order to clean it up. The Split Column options were all that was needed for a basic run through, together with changing the Data Type of some of the fields so that they are numbers rather than text.
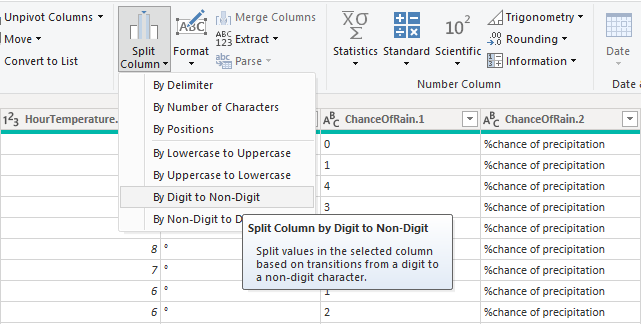
Looking in the Advanced Editor (pictured below) is the M Language generated by Power Query for the columns I split, renamed, and removed, and the changes I made to some Data Types.

With just those few queries (and adding an Index column for chronological sorting) there was enough clean data to very quickly make the weather forecast dashboard pictured below. Click to zoom in.
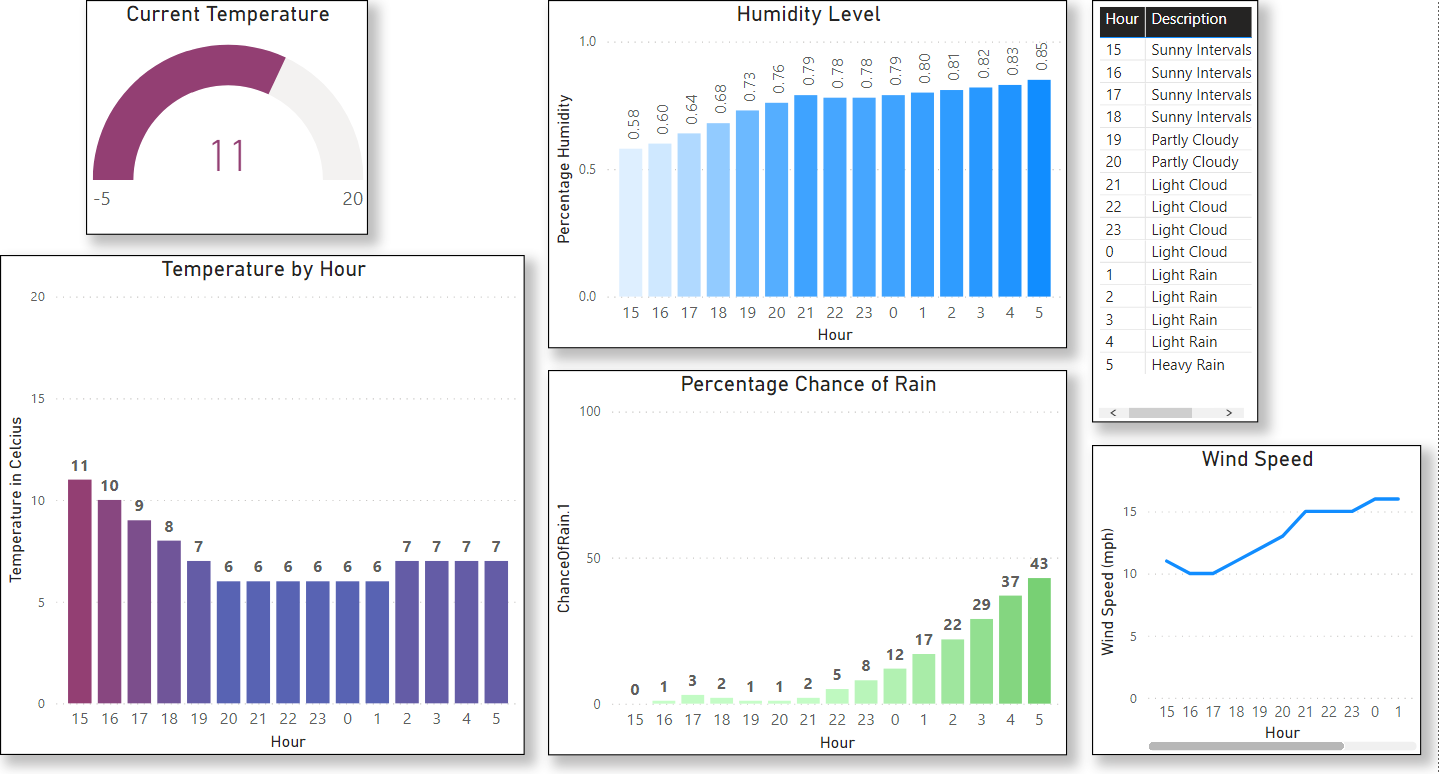
There are many parts of this which could have been made better with a little more pre-processing of the data and the creation of a few more columns.
- humidity levels are read in as percentages but displayed as values from 0-1, and as the hour of the day wraps around at midnight back to zero for the new day
- hour labels need to be enhanced – e.g. Tues22, Tues23, Weds00, Weds01 etc for clarity.
- need to display °C for temperature data, etc.