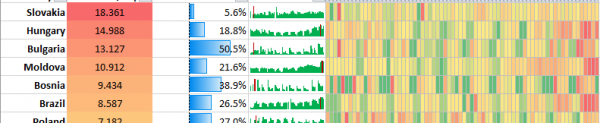
Category: Data Analysis / Analytics

5. More Power BI Experiments with Data Visualisation – Chess

Returning to Chess.com data (see here: http://www.neilmcniven.co.uk/3-conditional-formatting-of-bar-chart-colours-on-other-columns-of-data/), I had collected and saved all of my chess puzzle data from 29th Dec 2020 until 15th Jan 2021. Each day had its own CSV file looking like the one imaged below. Each row gives the date, puzzle rating, number of moves correctly made out of the target…

Read the full article

Covid-19 Check 07Mar21

Looking at the data from Johns Hopkins (https://data.humdata.org/) to see how various countries are doing at the moment with regards to their respective fights against the Coronavirus pandemic. The chart below shows the percentage increase in deaths due to Covid-19 for last week compared to the reports from the week before for countries with >500…

Read the full article

2021 Running Record – Jan to Feb

Here is my running record from 1st Jan – 28th Feb 2021. Click on the table image below to see the details clearly. * For details on the WMA age-grade scores, see here: http://www.neilmcniven.co.uk/comparing-the-quality-of-timed-runs-of-different-distances/. Below are my record 7 day and 14 day total running distances from 2019-2021 inclusive.